Published by Taylor Financial Group
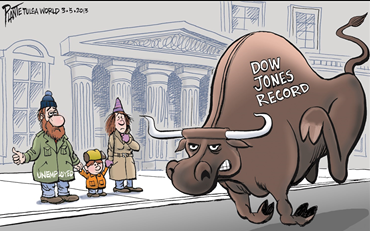
You may have noticed some recent gains in the market, including a recent surge in the Dow Jones Industrial Average. Maybe you are wondering, if the Dow’s performance is up nearly 6.2% year-to-date and hitting record highs, why isn’t your portfolio reflecting the same thing? The answer is simple, your portfolio does not look like the Dow. Nor does the Standard & Poor’s 500 Index or the NASDAQ. In fact, the exceptional performance of the Dow is due to just a few stocks held within the 30 components of the Dow.
Why is the Dow Outperforming?
The Dow has outperformed (for example, gaining 1,200 points the month after Donald Trump’s election) due to a few factors. Four key players within the Dow – Goldman Sachs, Caterpillar, JPMorgan and UnitedHealth Group – have been largely responsible for much of the gains.
The Dow is a price-weighted index, so its gains are reflective of its largest top performers. Although the Dow’s improved performance is a sign of optimism for the market, it should not provide false expectations for your personal portfolio, which is generally much more diversified than holding 30 stocks. Indeed, just three stocks – Goldman Sachs, United Health and Caterpillar – were responsible for half of the Dow’s huge one month rally through December 5, 2016.
Your Portfolio Does Not Look Like the Dow
Some skeptics believe that due to the price-weighting of the Dow, past gains are not sustainable, and we are seeing some giving up of those gains over the last month. Indeed, the major concentration in a few large high performing stocks can help or hurt, which is why many believe the S&P 500 Index is a more reliable barometer.
If you were to put all of your money in one small basket of stocks, and one of those stocks within the basket were to decline drastically, your portfolio’s performance would reflect that. For example, as of March 16, 2017, Goldman Sachs Group Inc. (GS) stock price was trading at $248.84, but if you look back to March 16, 2016 it was trading around $150.92. It wasn’t until November 2016, post-election, that the stock rose to over $200. Prior to that, the stock was basically trading flat for the last five years or more.
By broadly diversifying your portfolio among different sectors and asset classes, you reduce your exposure to risk and provide a way to safely meet your goals within your own time horizon. In the event of a downturn in one sector, your portfolio can remain balanced and recover more readily from minor losses or setbacks.
If you have questions about your portfolio or want to schedule an appointment to review your portfolio, please give us a call today.
Sources:
CNBC, Just Three Stocks Are Responsible for Almost Half of the Dow’s Huge One-Month Rally, December 5, 2016
CNBC, Four Stocks Are Responsible for Almost all the Dow’s Gains in 2017, February 7, 2017
MarketWatch, Dow Industrials Post Best Annual Gain in 3 Years, December 30, 2016
Wall Street Journal, The Return of the Fed, March 2, 2017
CNN Money, Dow Jones Indu Average Index, March 15, 2017.
CNN Money, Dow zooms over 1,200 points since Trump victory, by Matt Ega, December 7, 2016
Yahoo!Finance, The Goldman Sachs Group, Inc. (GS), Historical Prices, March 16,2017.
Securities offered through Cetera Advisor Networks LLC, Member FINRA/SIPC. Investment advisory services offered through CWN, LLC, an SEC Registered Investment Adviser. Cetera Adviser Networks is under separate ownership from any other named entity.
Content in this material is for general information only and not intended to provide specific advice or recommendations for any individual.


